Forces
- Finding client side performance of a web application in the production environment.
- Making changes or adding instrumentation on client side code at production stage is dangerous.
- HTTP profiling tools do not provide rendering time details.
- Make the web application behavior uniform across different execution environments like IE 6, IE8, FireFox, Chrome, etc, since Array.sort() consumes processor utilization in IE than other browsers and Array.join() takes very less in IE than others.
SolutionWe are doing performance engineering of our web based product and now we are more concentrated on client side performance improvements. With the help of available toolset like Fiddler, IE Development Toolbar and some others, it is possible to tweak the code points based on download time and size of the critical ASPX pages. In addition to this, We would like to know the browser rendering or loading time of a behavior, however none of the tools do not provide such clarity. IE Development Toolbar enables to profile JavaScript but in an ad-hoc manner. I was googled various places, and failed to get such tool. I finished my journey at Microsoft Research where I found a tool called “AjaxView”, which enables to inject instrumentation code such as performance profiling, infinite loop detection, etc on the fly even in the production environment by the following nature of web applications:
- Easy and instant deployment
- Dynamic extension (you can add any stuff on the response of a web request)
Thanks to Emre Kiciman and Benjamin Livshits at Microsoft Research for implementing this great tool.
How Does It Works
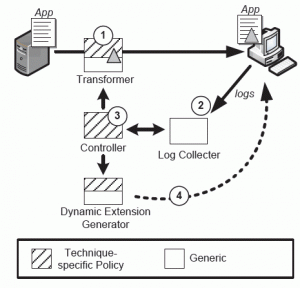
AjaxView sits between the web server and clients, acts as server-side proxy. It intercepts and rewrites the JavaScript code generated from the web server for a web request by a client. It does not affect the production (or development) environment. See the following figure.

AjaxView Platform

AjaxView Components
- A component (Transformer) which automatically rewrites the actual code to serve differently instrumented versions.
- One or more components (Controller and Log Collector) which should continuously observe the end-to-end application behavior on the client side.
- The observed results are then analysed and used to guide the adaptation of the dynamic instrumentation policy (Dynamic Extension Generator).
AjaxView supports the following broad categories of instrumentation policies:
- Performance
- Runtime analysis and debugging
- Usability evaulation
Let us see a practical walk-through on the next post for better understanding of this tool.
References
- Visit http://research.microsoft.com/en-us/projects/ajaxview/ to know about this tool (or platform) and download.
- Read the AjaxScope: A Platform for Remotely Monitoring the Client-Side Behavior of Web 2.0 Applications white paper to know in depth about this tool.
- To know in depth details of the adaptive and distrubuted instrumentation, read the Live Monitoring: Using Adaptive Instrumentation and Analysis to Debug
and MaintainWeb Applications white paper.